What else was happening?
An AI-powered research and museum discovery interface.
Built independently: Concept, research, data structure, AI pipeline, interface design, frontend development. Dataset: 300+ Harvard Art Museums objects
Tools: Harvard Art Museums API, Claude API, Claude, React + Vite, Cursor, JSON pipeline
Scale: 300+ objects, 6 relationship categories
What else was happening?
An AI-powered research and museum discovery interface. The project begins with one object and opens the collection outward into a field of relationships. Using Harvard Art Museums API data and Claude-powered relationship mapping, each object becomes the center of a visual constellation — showing what else was being made, used, traded, or imagined around it.
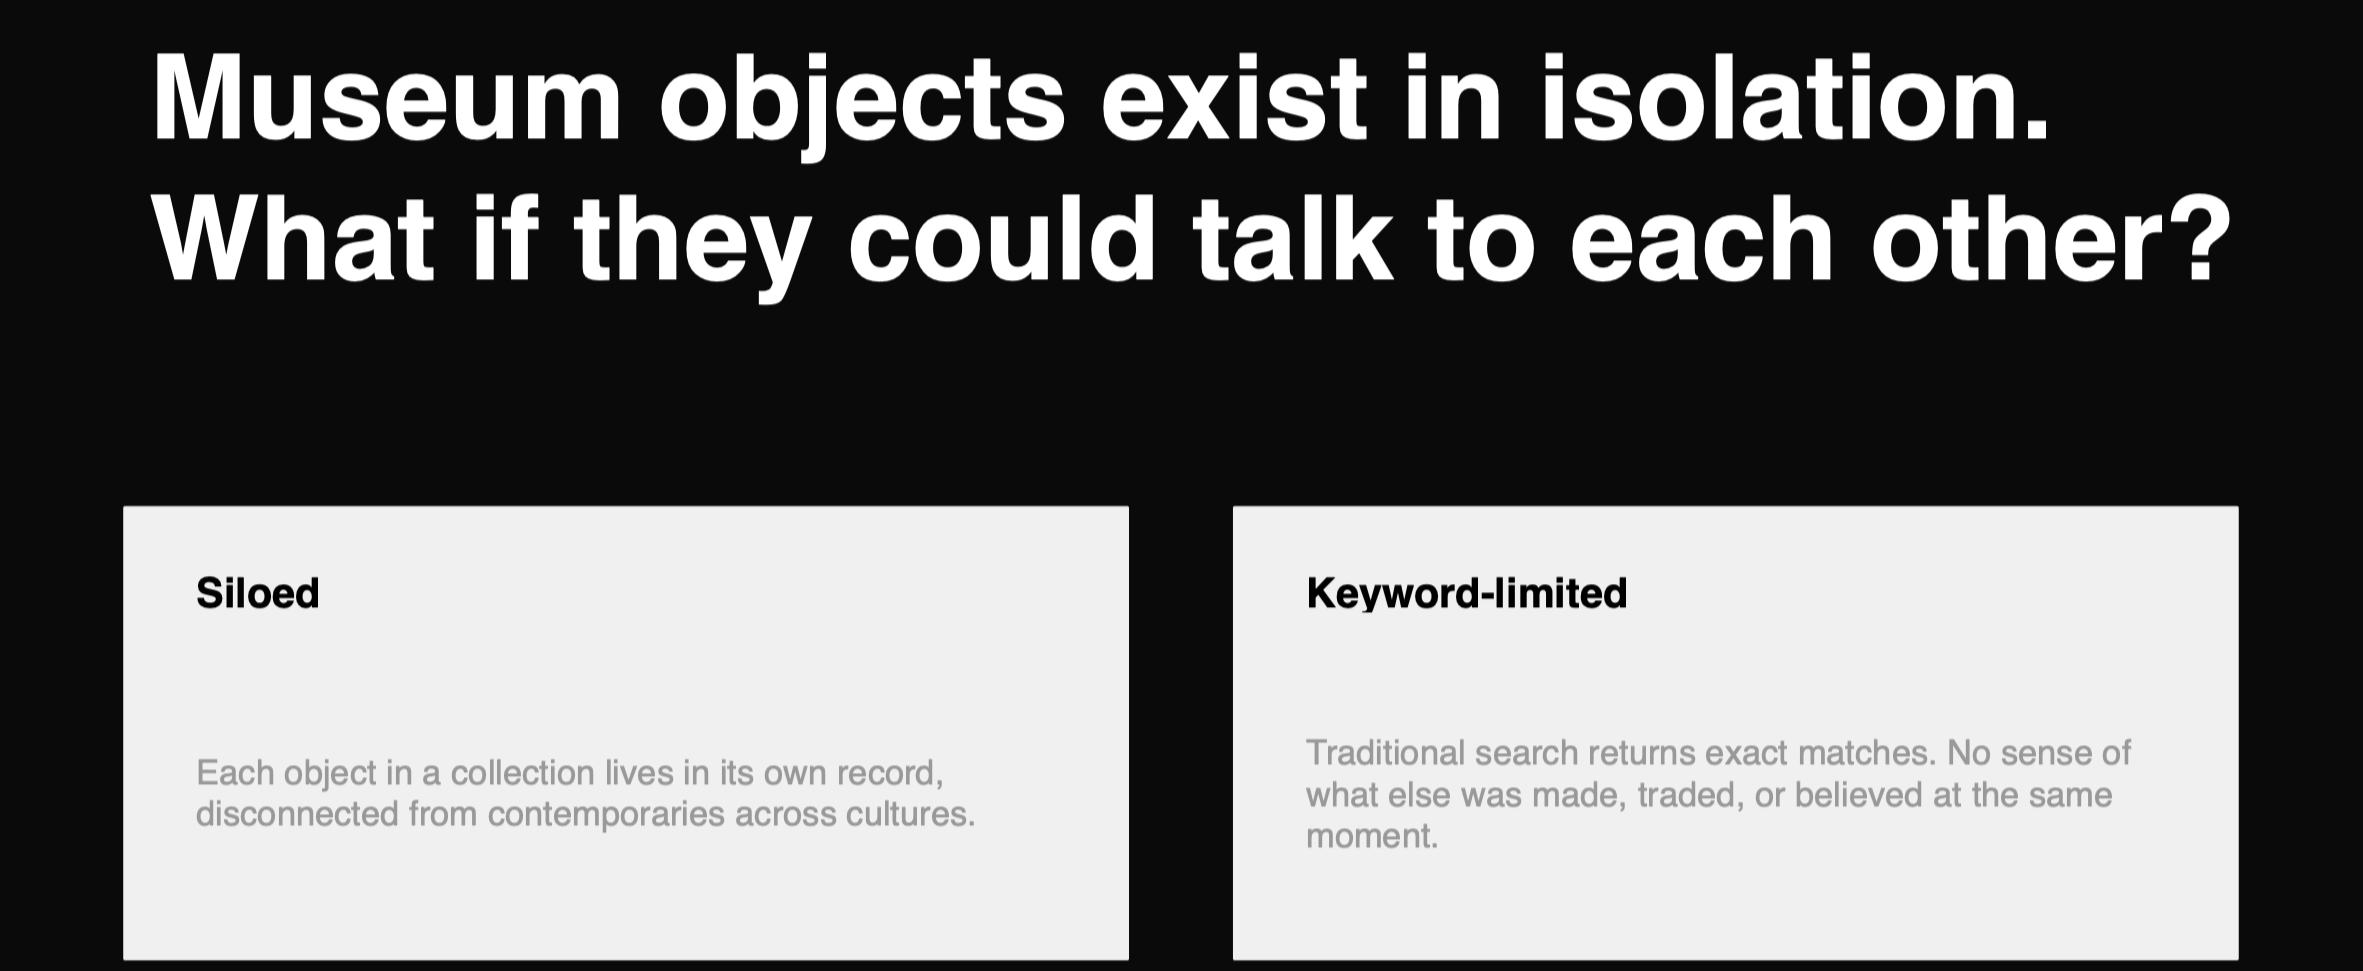
The Problem
Harvard Art Museums’ online collection is extremely rich, but its search tools are primarily organized by cataloging logic: period, region, medium, department, and classification. These categories are useful for research, but they do not always match how people learn in museums — where discovery often begins from one object that catches your attention.
The Premise
Instead of starting with a search term and narrowing down, this project begins with a single object and lets the archive unfold outward from it: by what the object looks like, what it is made of, what it was used for, and what else was being made at the same time elsewhere in the world.
Product experience
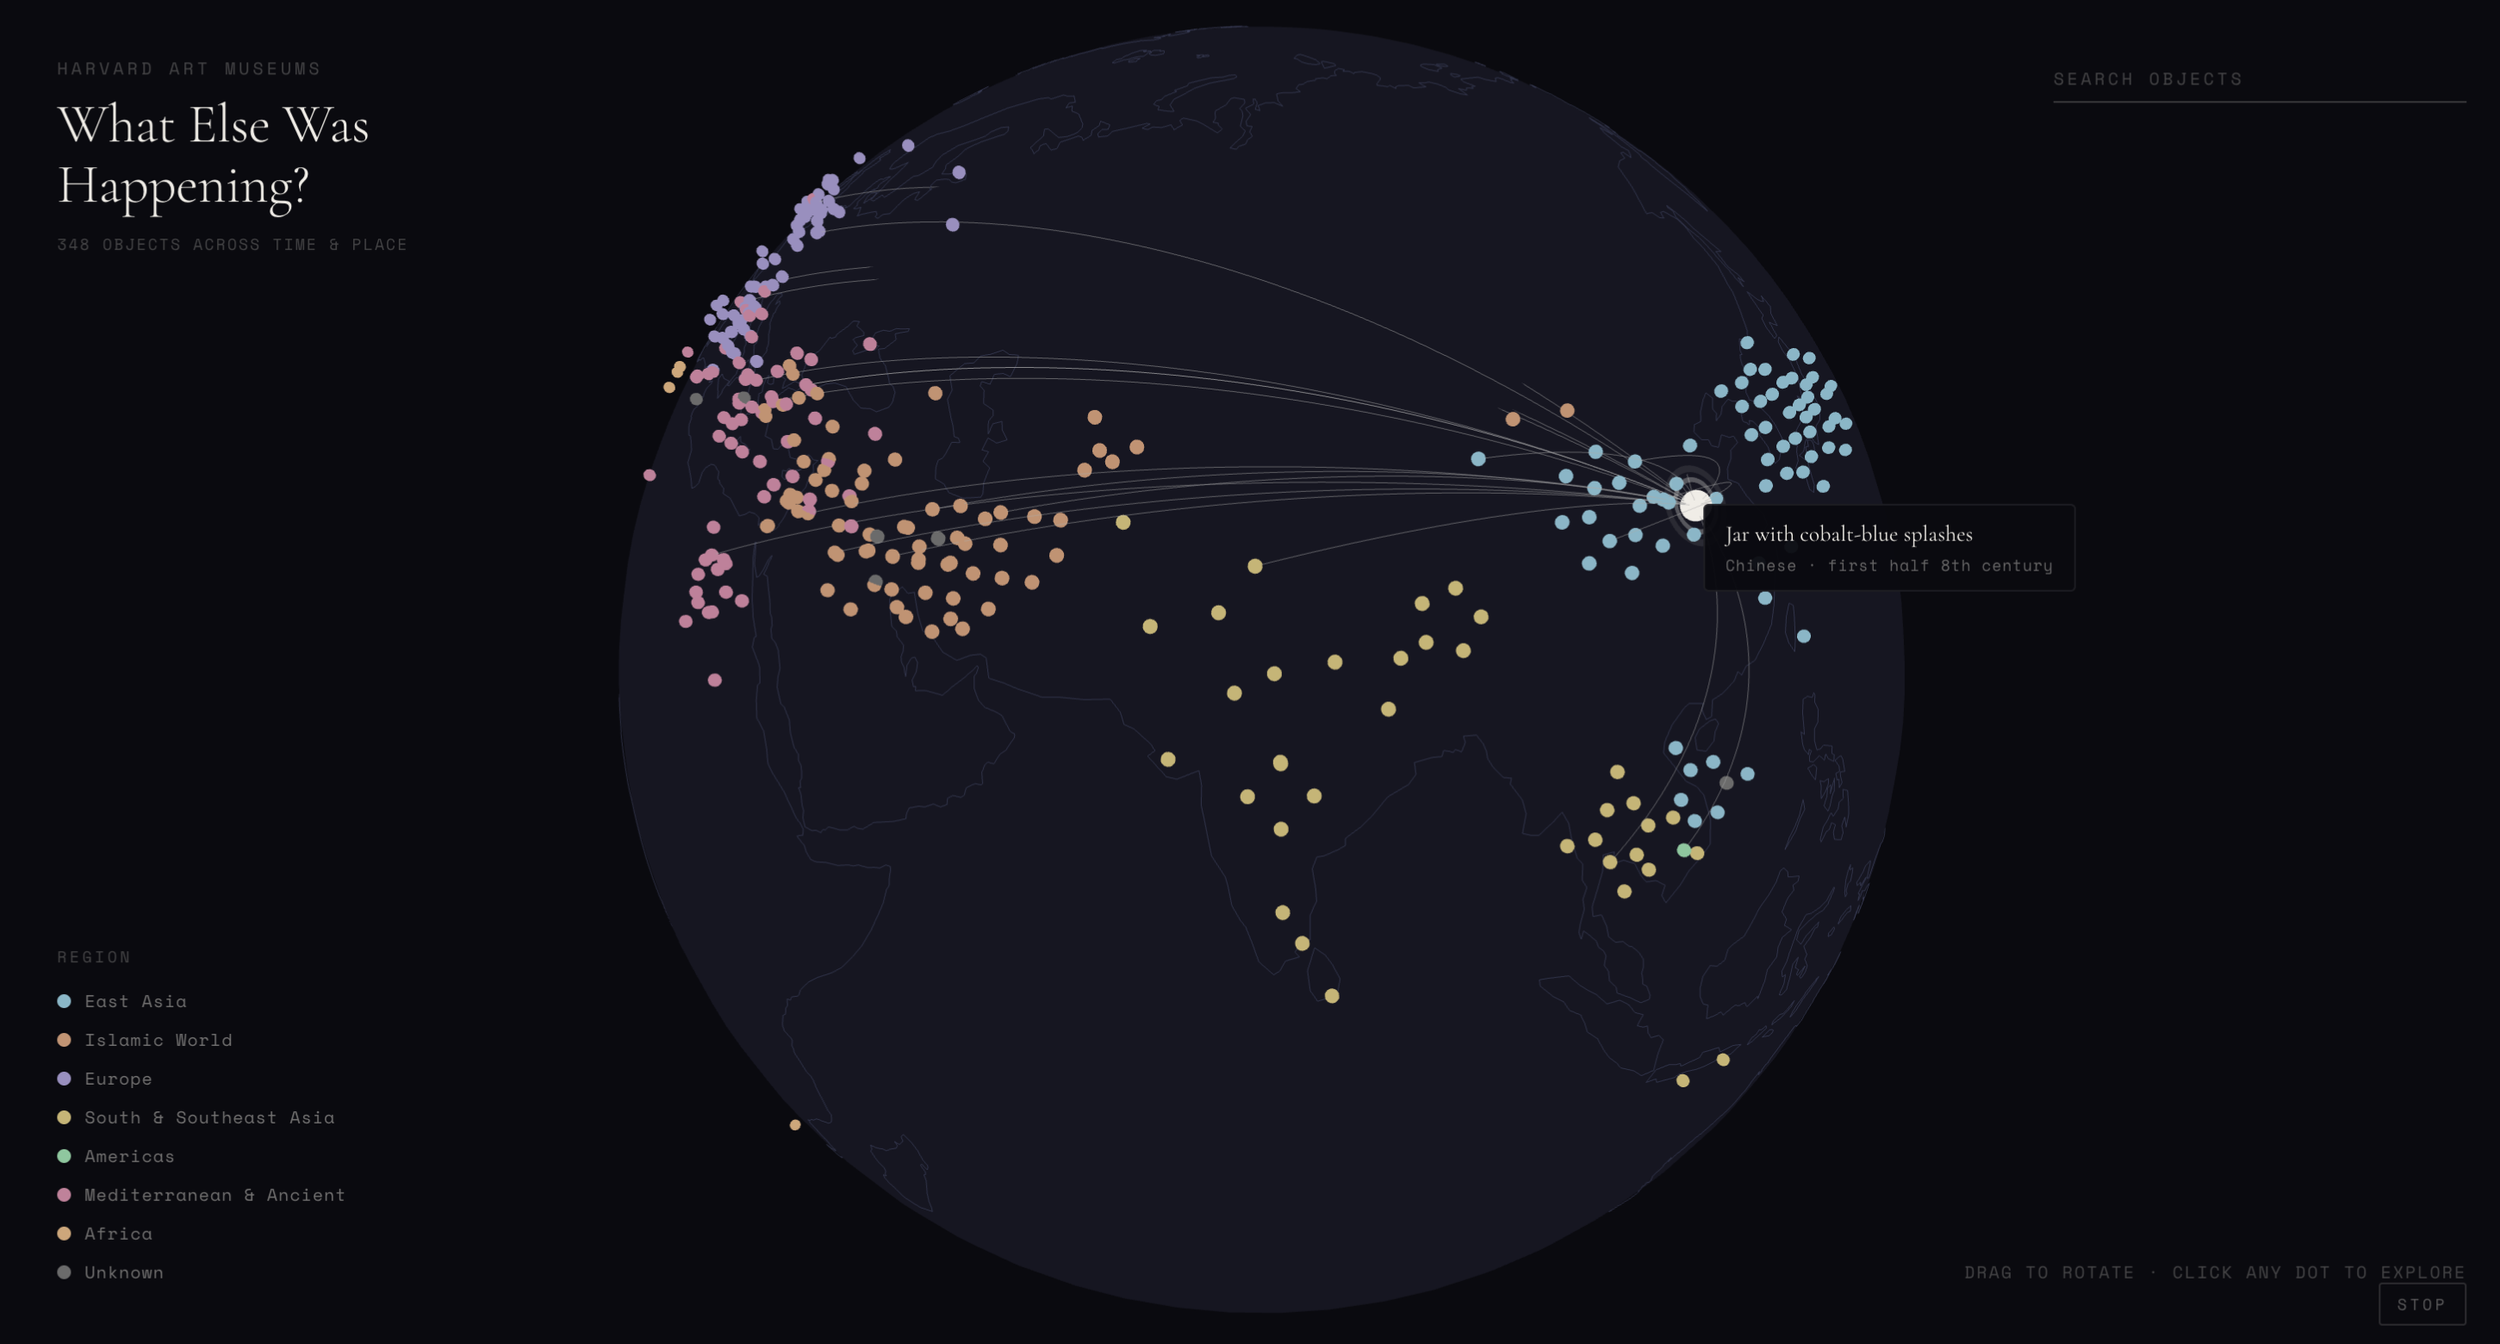
Start from the collection as a world map
The interface opens on a globe, where each object appears as a dot placed near its geographic origin. Different colors distinguish different regions. Hovering over a dot reveals lines connecting that object to related objects around the world.
Six ways to move through the archive
Objects are linked through Color, Material, Motif, Function, Same Time / Different Region, and Different Time / Same Region. Each category surfaces related objects across distinct regions or cultures, allowing comparison without claiming direct influence in every case.
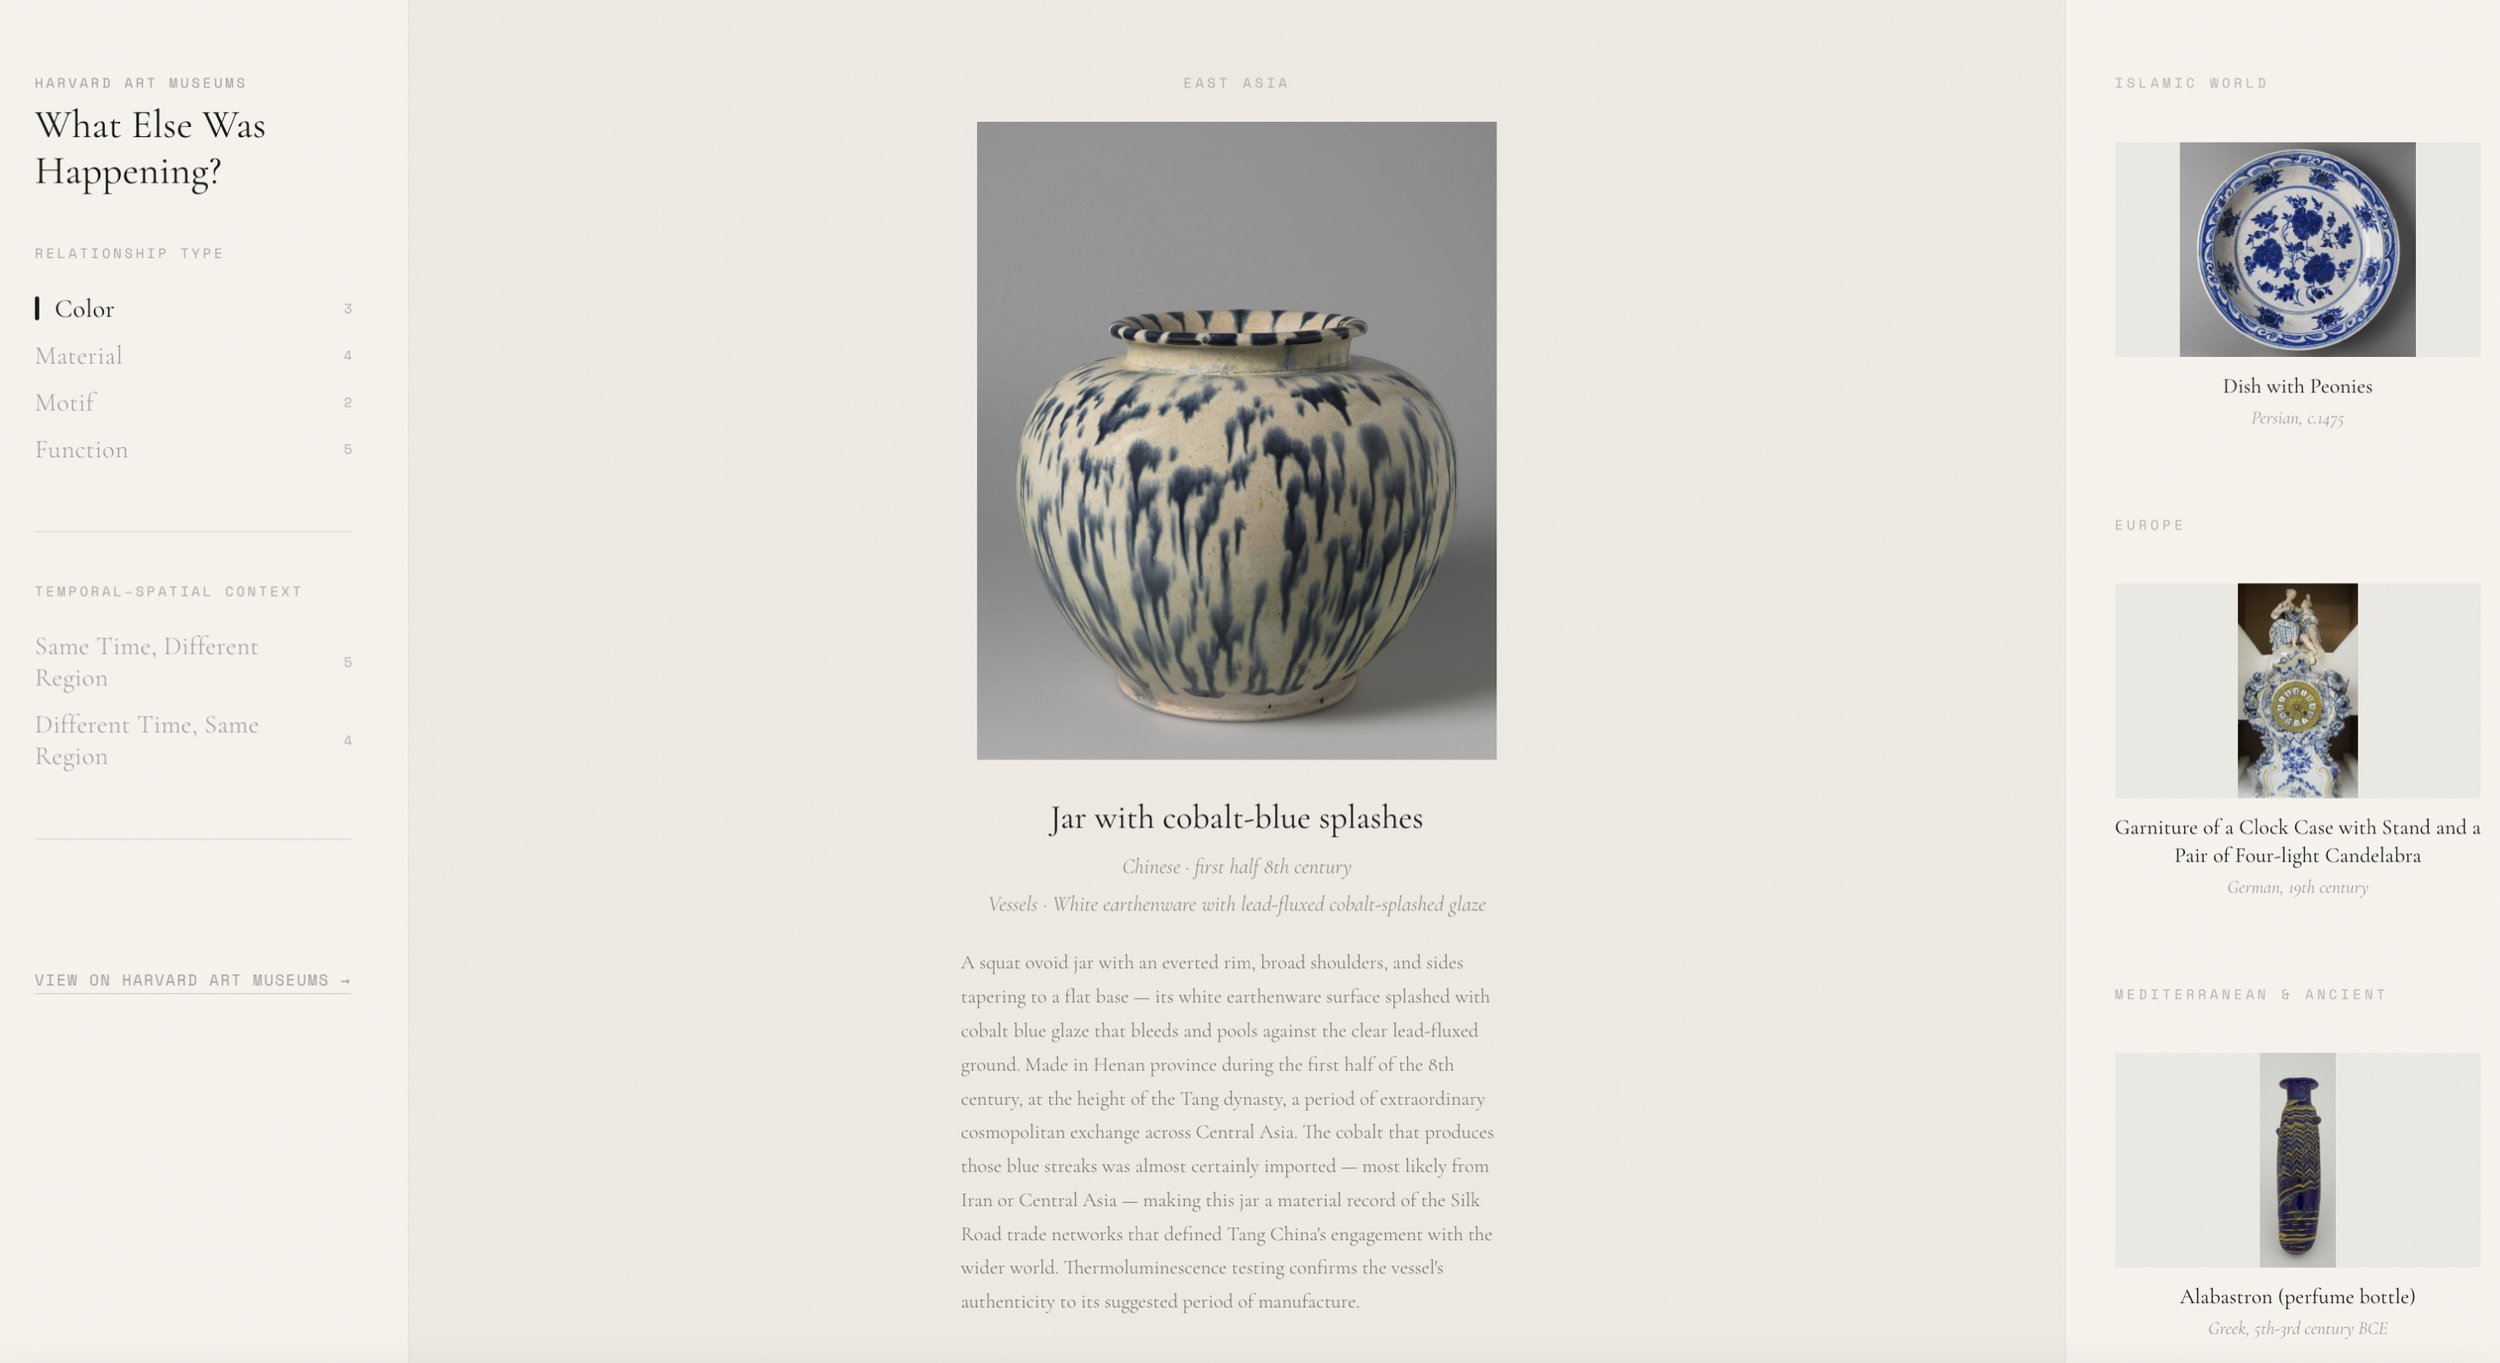
Case example
The cobalt made a round trip: material moved west to east, while aesthetic influence moved east to west.
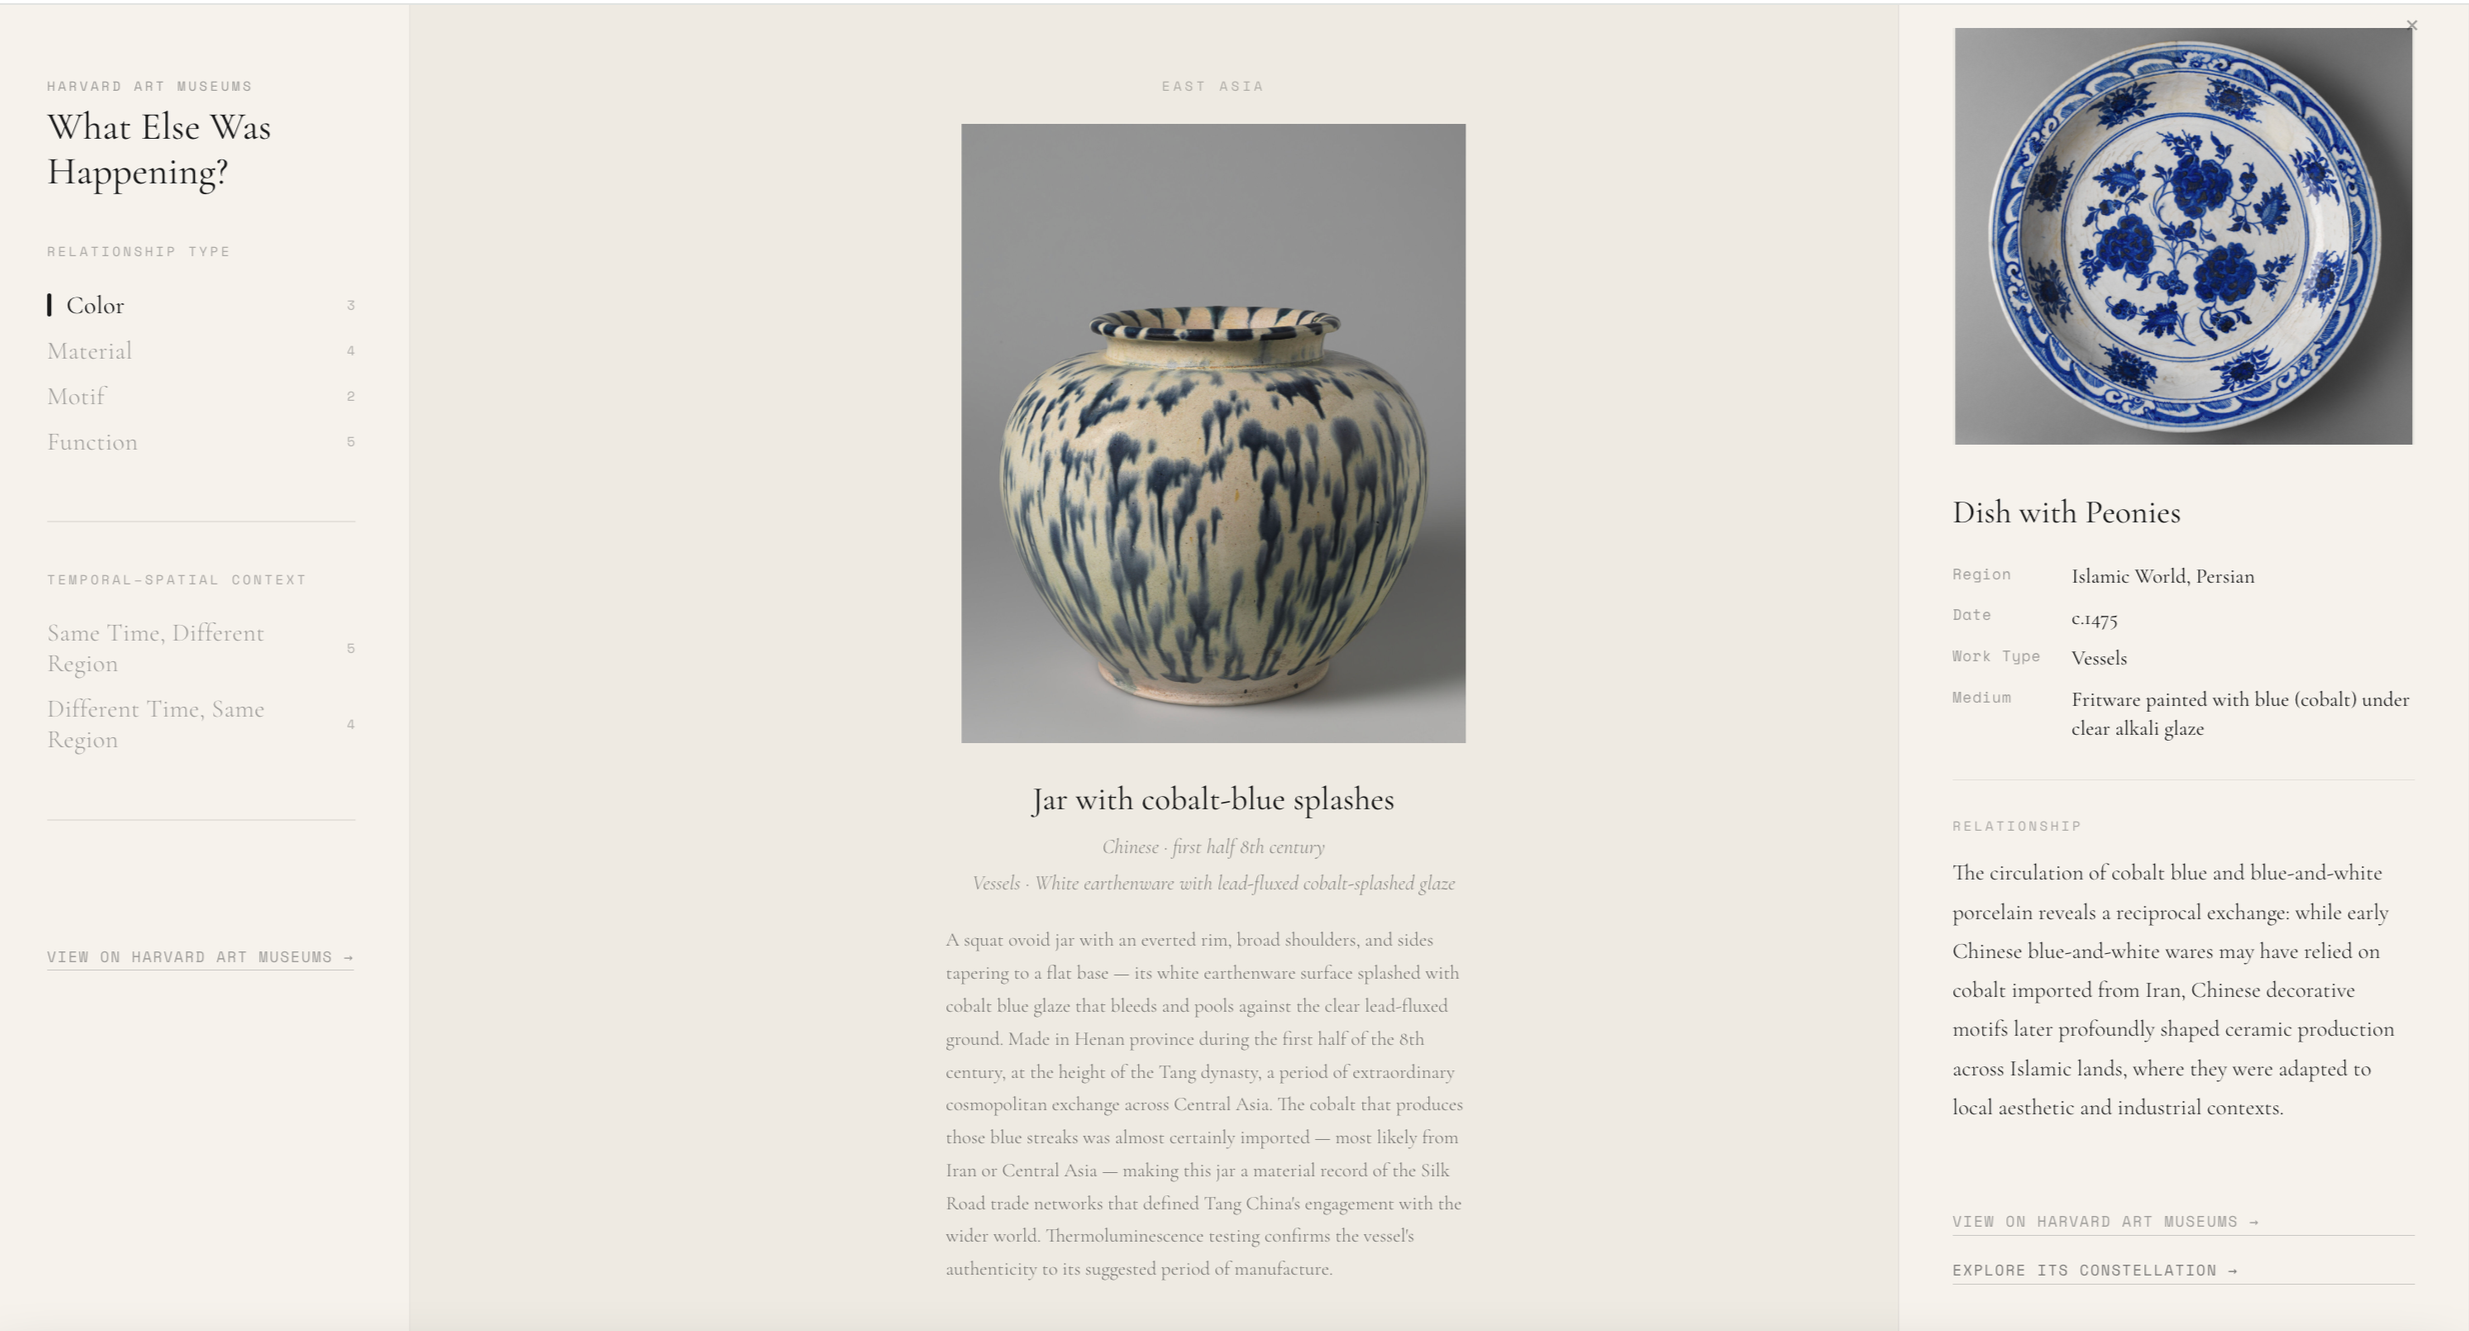
The Tang Dynasty jar was chosen as the primary demonstration anchor because it makes the project’s logic visible. Its cobalt pigment was likely imported from Iran or Central Asia, making the object a material record of Silk Road trade. The blue-and-white aesthetic later developed by Chinese potters using imported cobalt eventually traveled back toward the regions where the material originated, influencing ceramic production across Islamic lands. Centuries later, European demand for Chinese blue-and-white porcelain helped drive the development of porcelain industries in Europe. Through one object, the user can move between material exchange, aesthetic influence, trade routes, and later global imitation.
Any object can become an anchor
Clicking an object makes it the center of its own relationship map. The user can then explore related objects through two groupings: relationship type and temporal-spatial context.
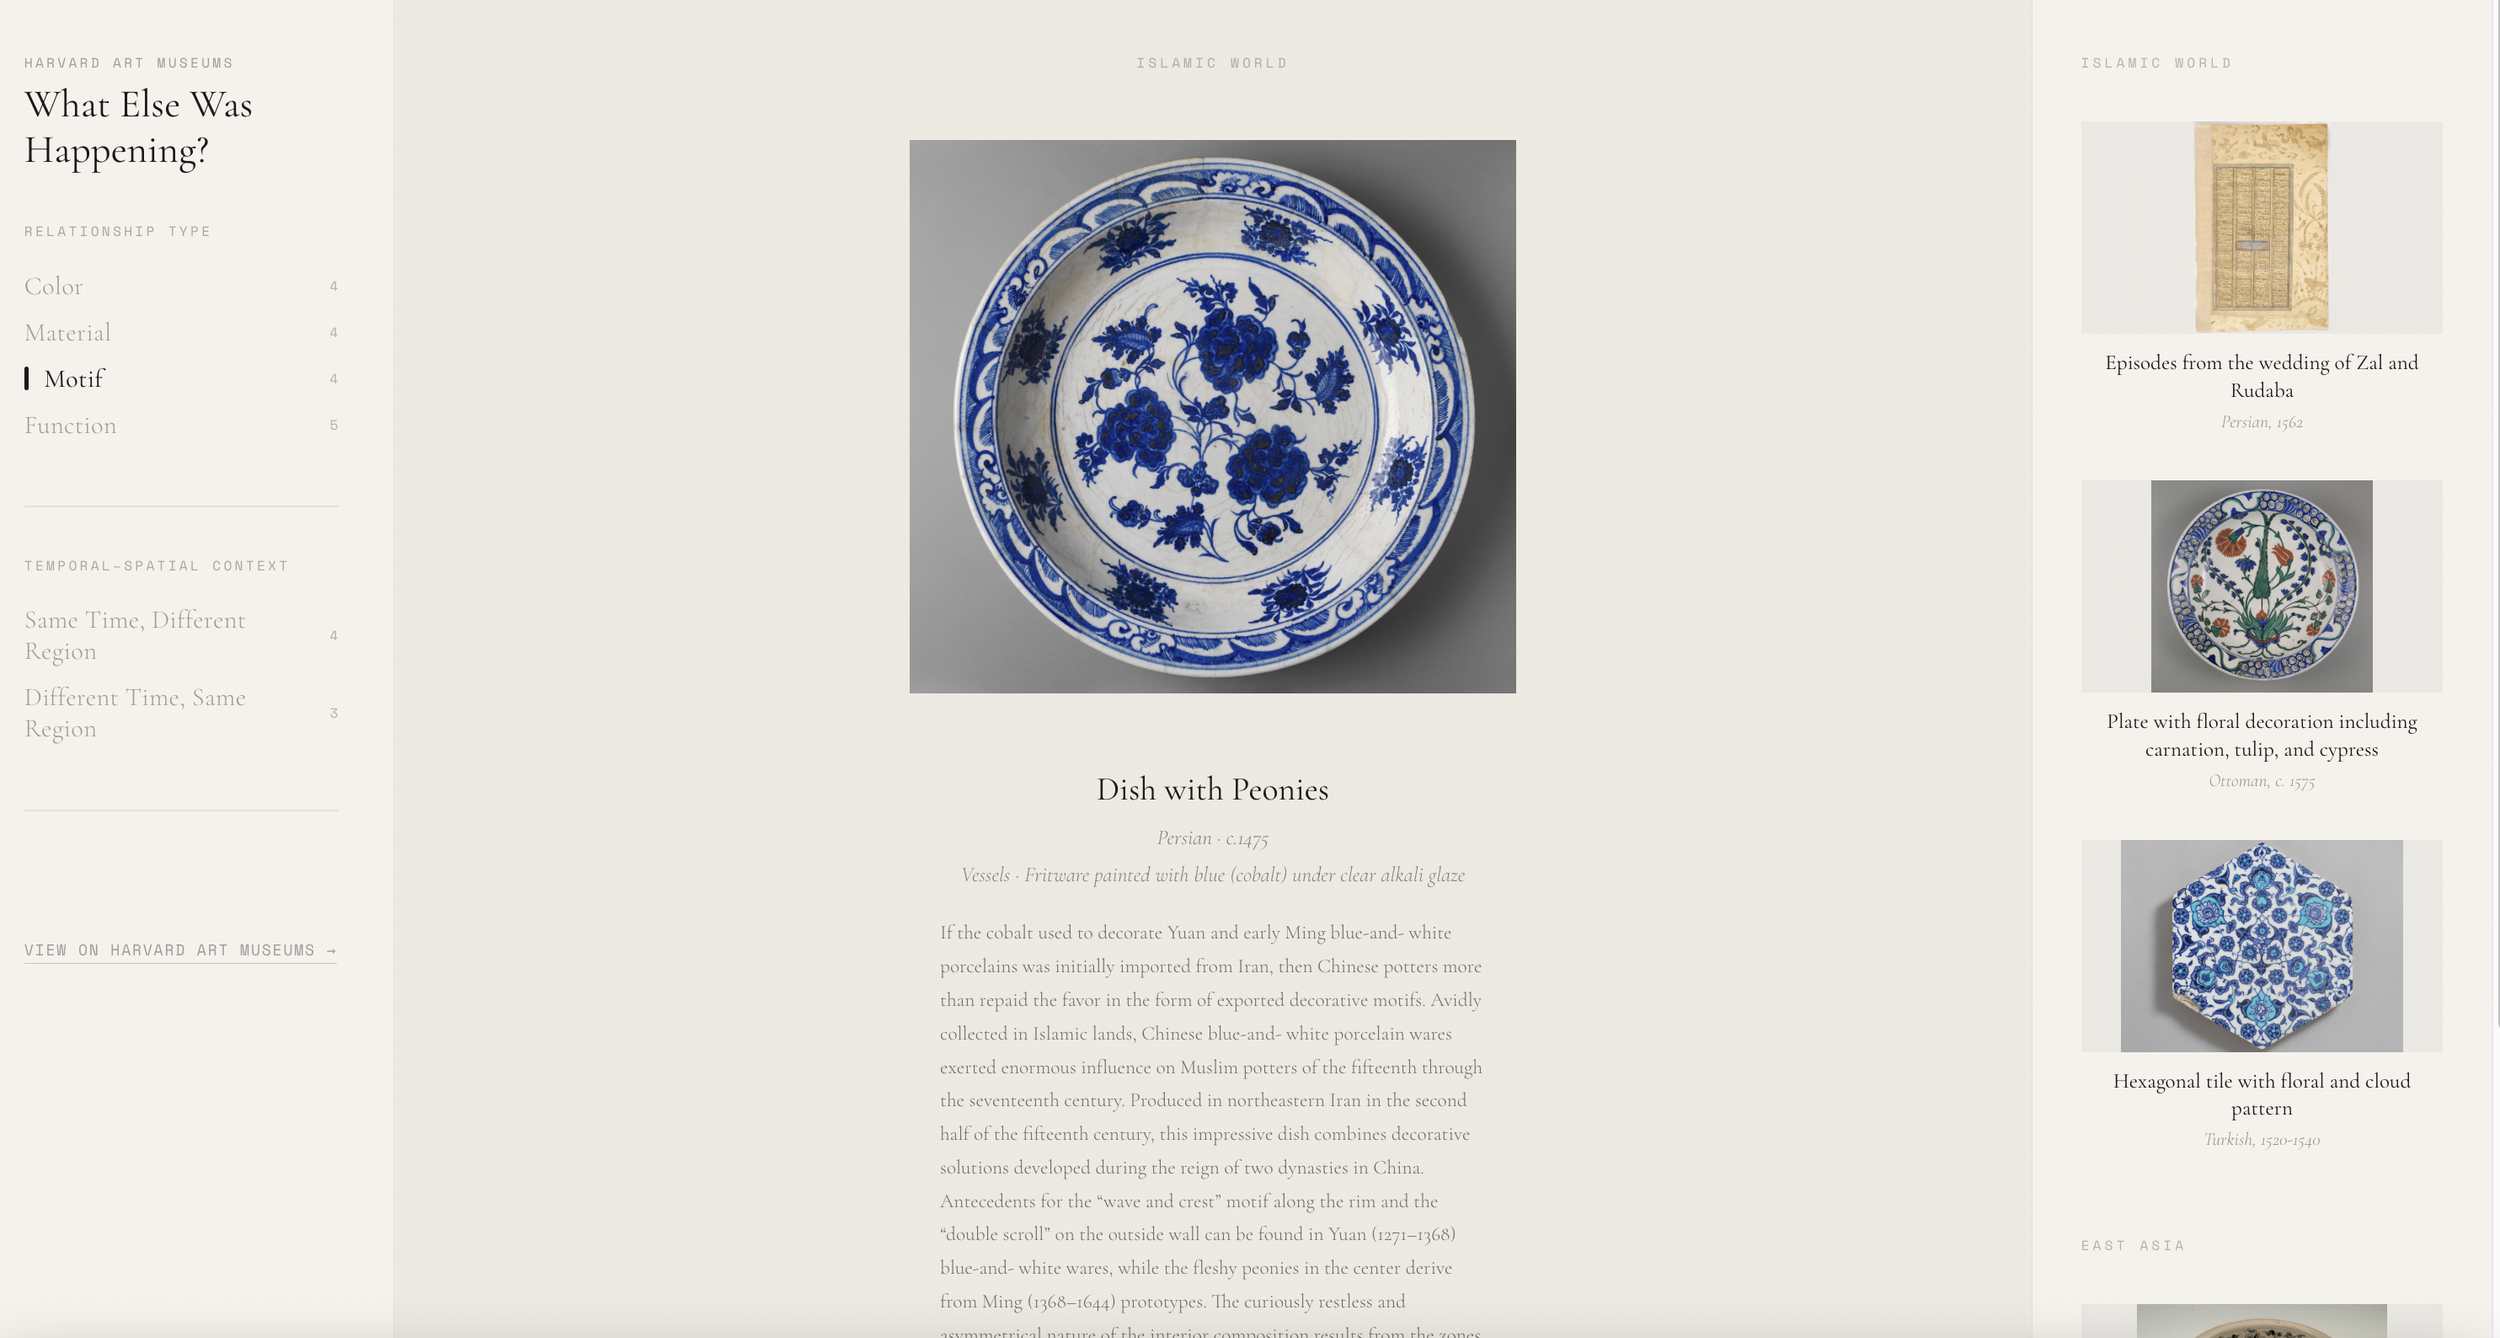
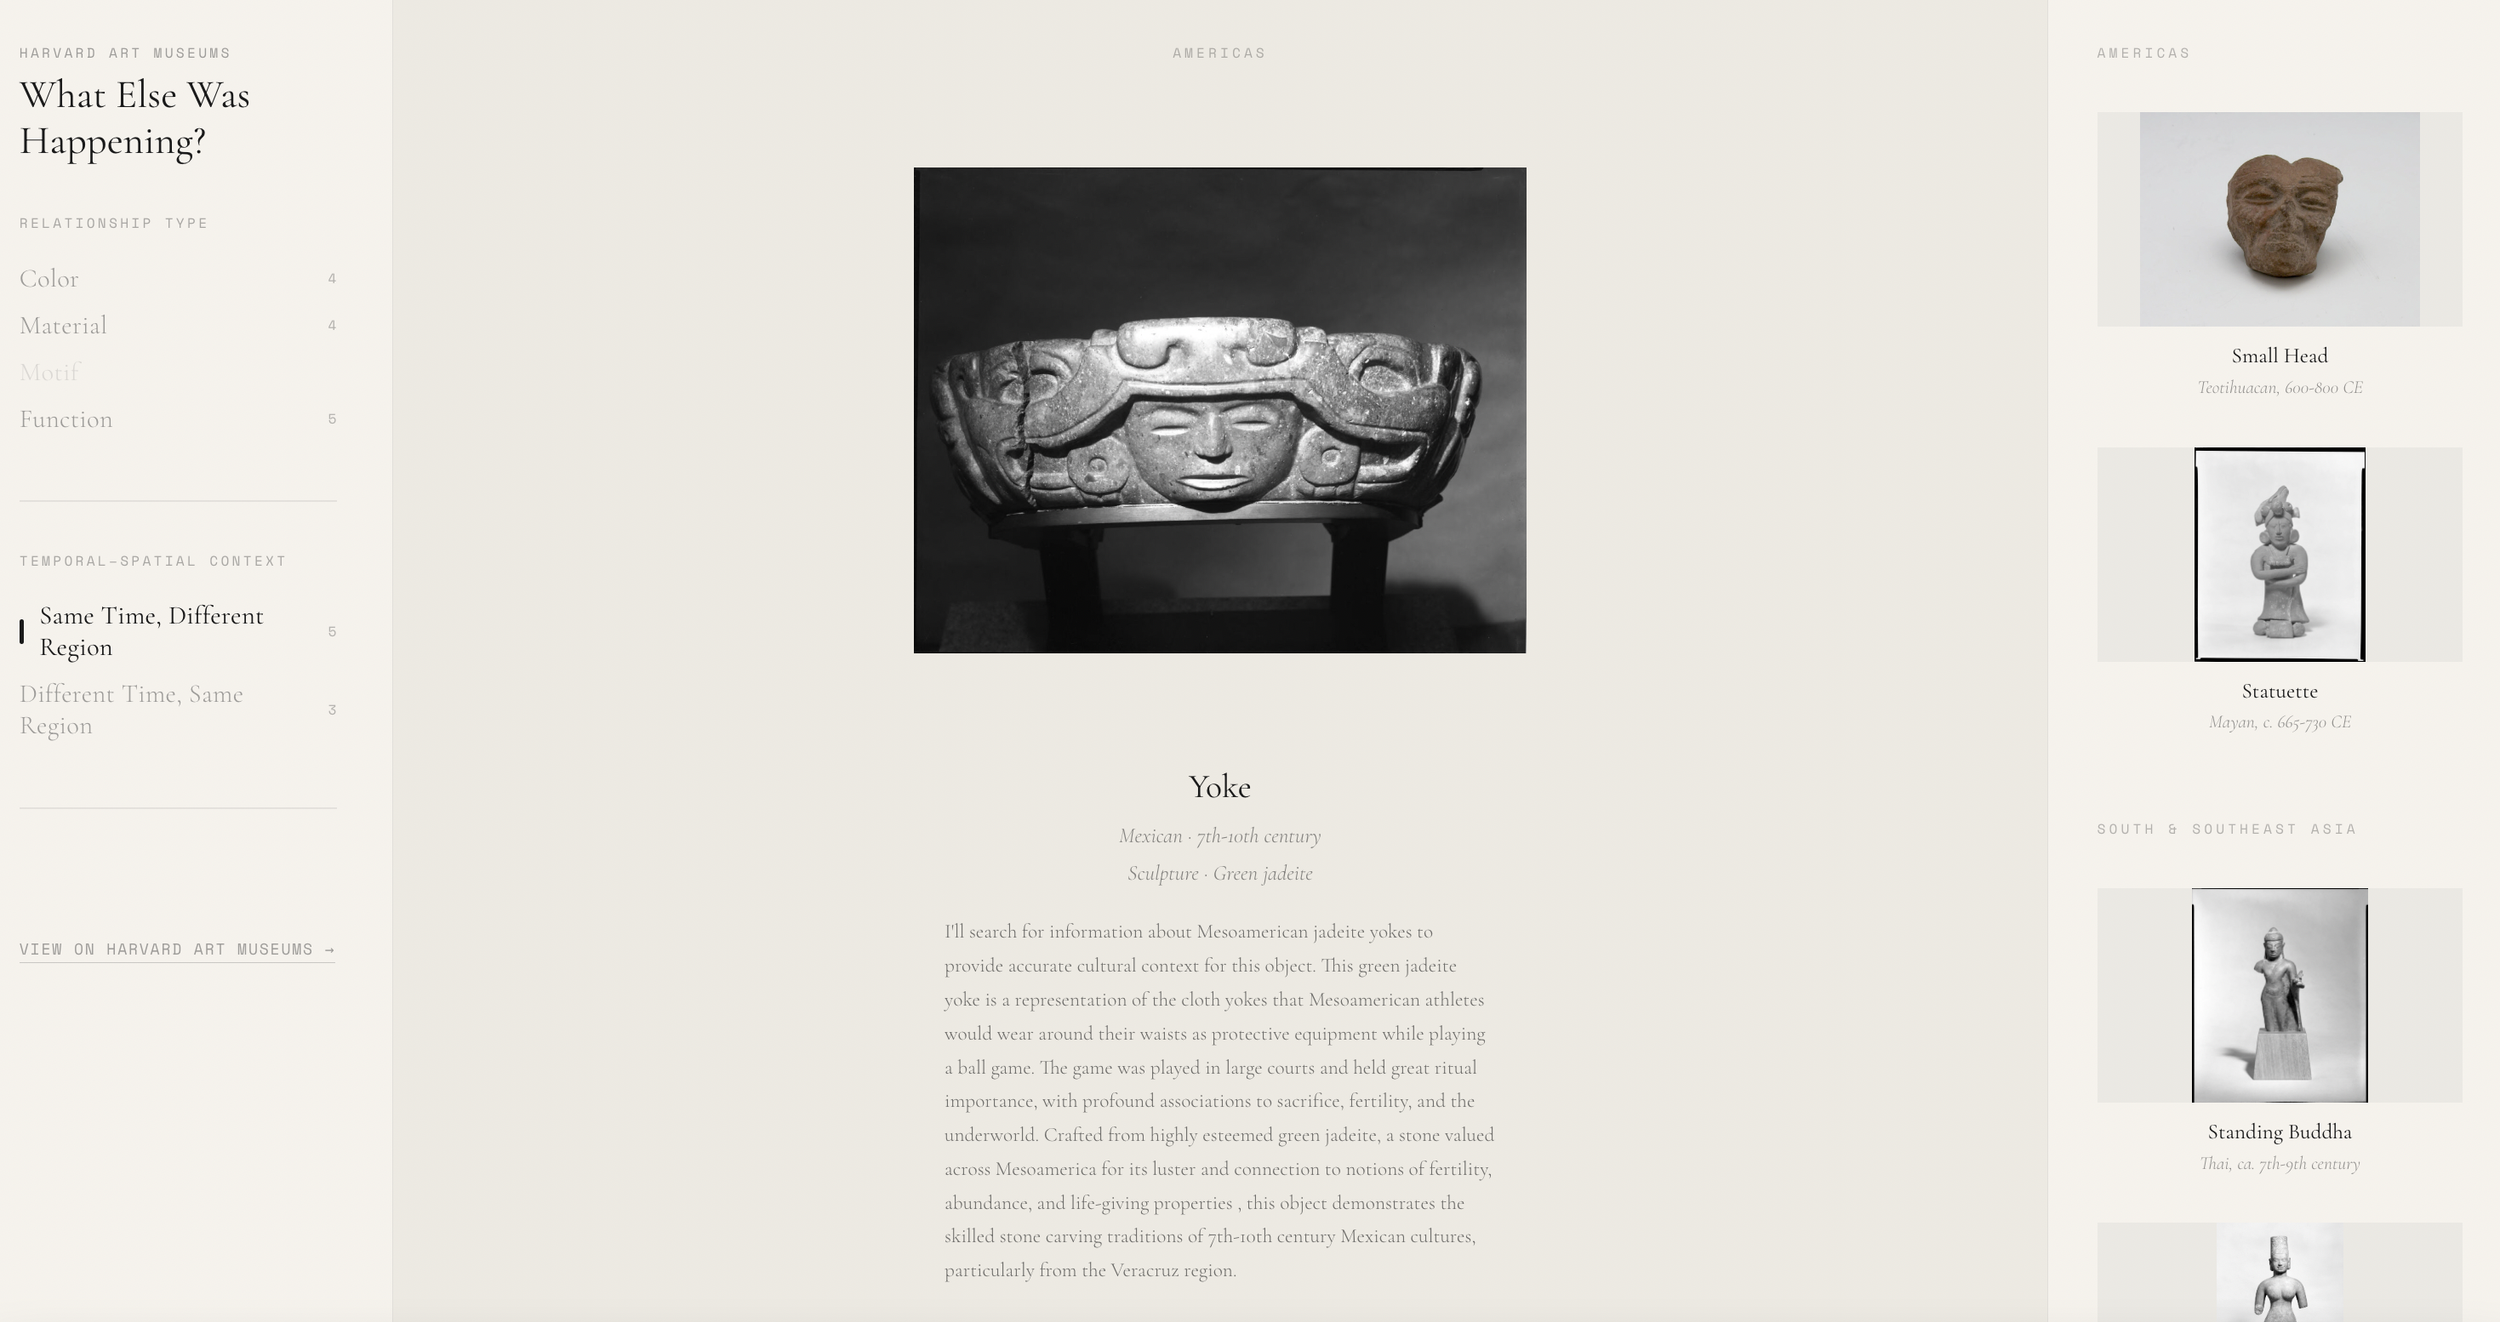
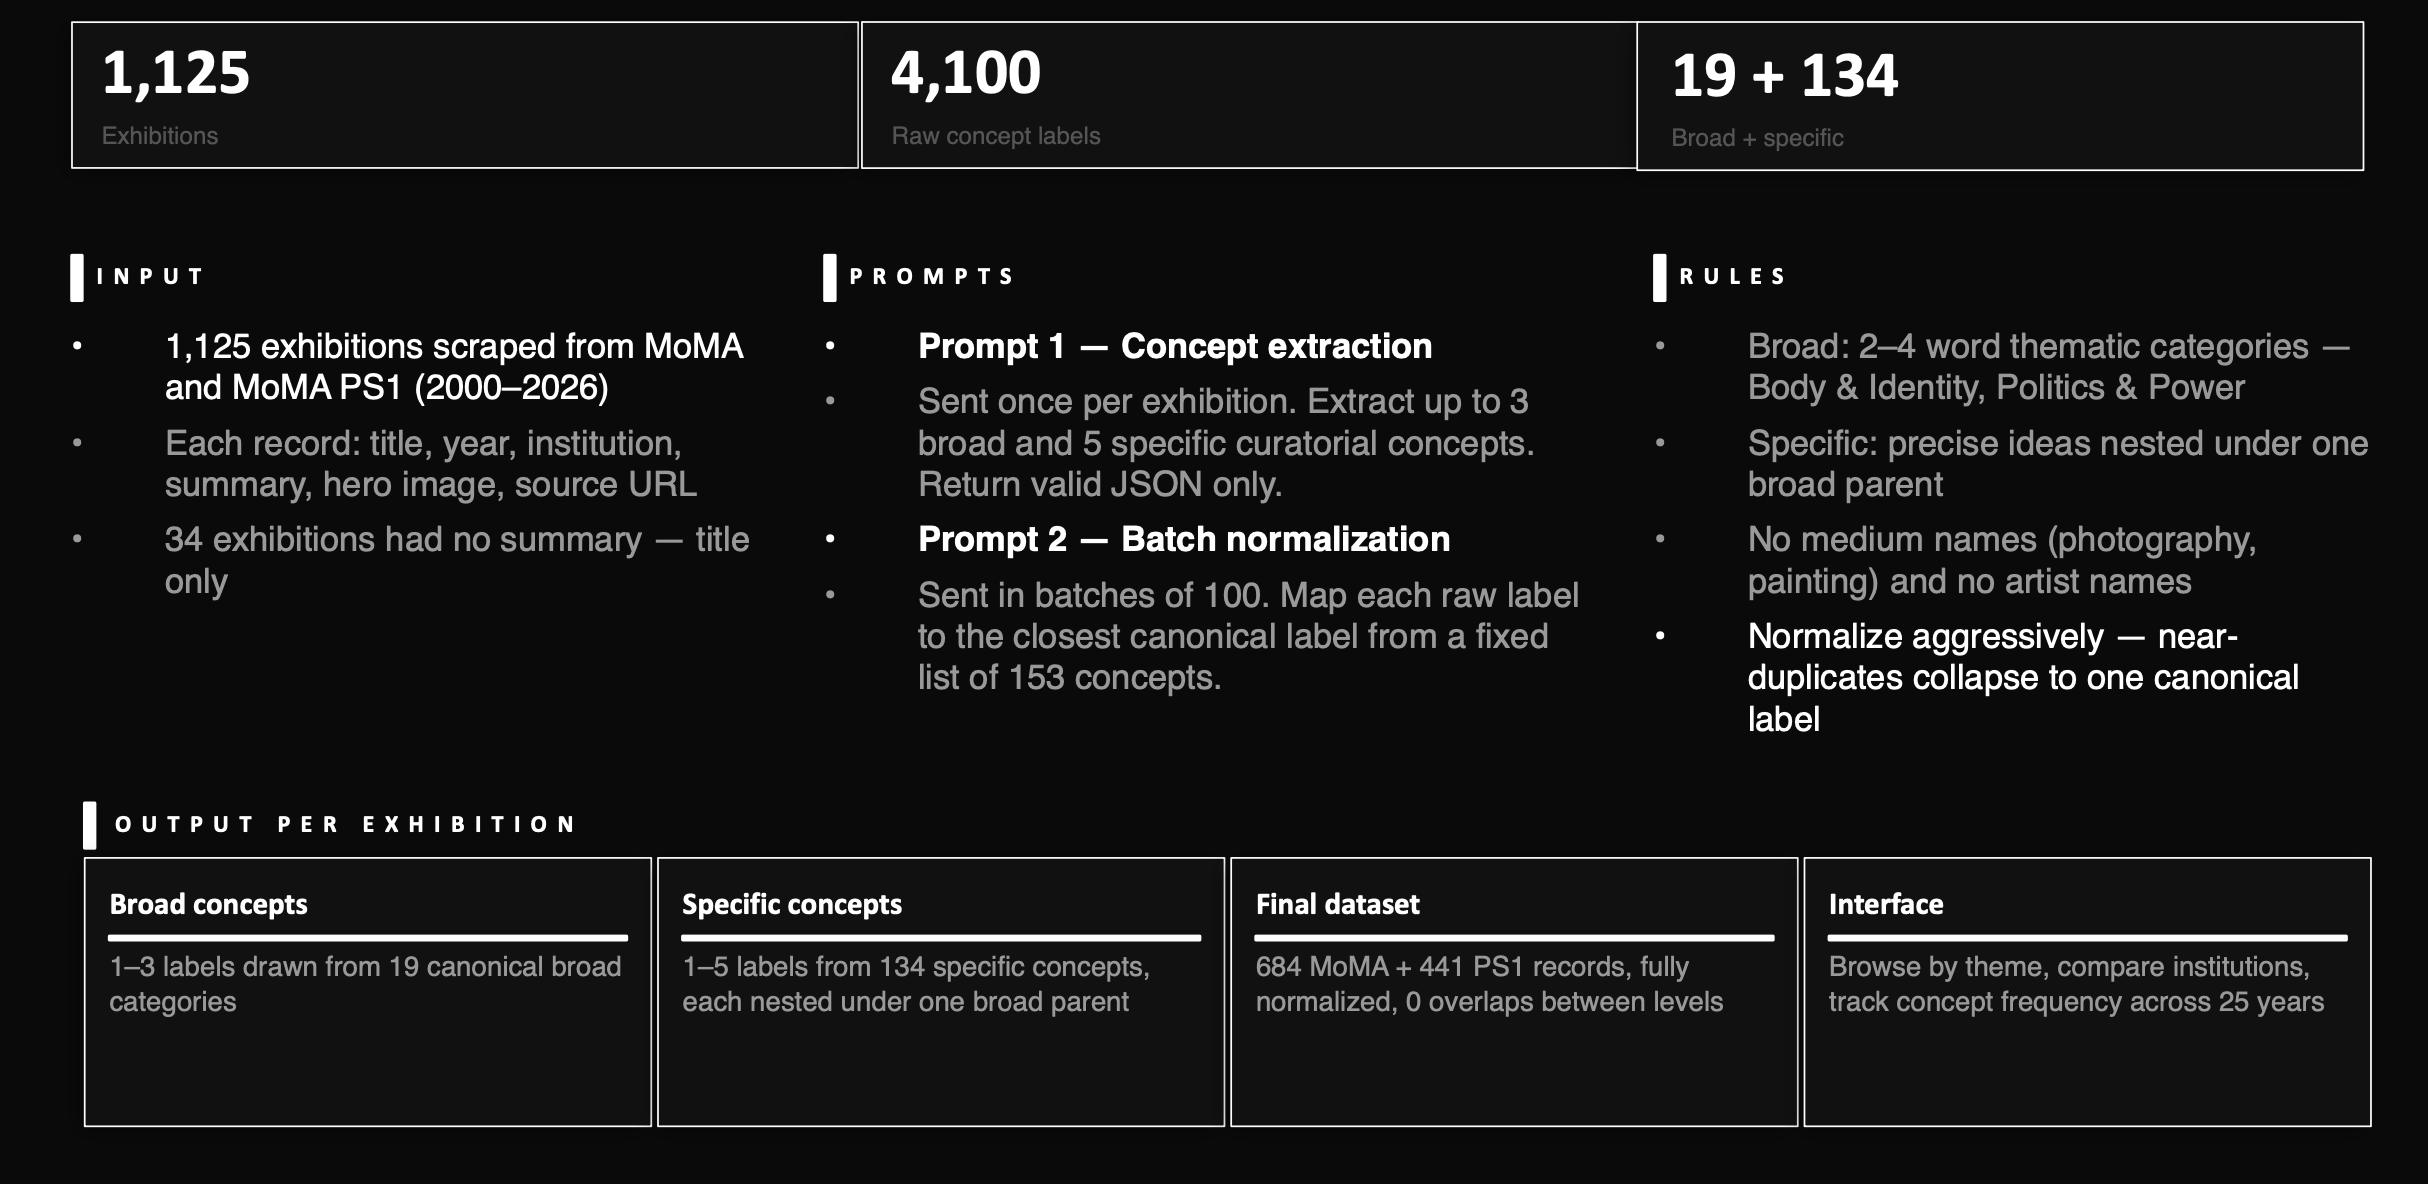
Workflow / Pipeline
Final outcome
From collection records to relationship maps
What Else Was Happening? transforms a museum collection from a searchable database into a relational research interface. Each object becomes the beginning of a path rather than the end of a search result.
The final prototype lets users explore how objects connect across visual similarity, material exchange, shared function, historical period, and geographic difference. It does not claim that every connection is direct influence. Instead, it creates a structured space for comparison and curiosity — allowing users to ask what else was being made, used, traded, or imagined around the same object.
The outcome is both a museum-learning tool and a proof of concept for AI-assisted cultural data structuring: Claude helps create the interpretive relationship layer, while the interface makes that layer visible and navigable.